


Big Ten Conference
Power 4Women's Basketball · 18 teams · 225 scored athletes
Last updated: July 30, 2026 · refreshed daily
Avg NIL Score
Teams

UCLA Bruins
9 scored players
73.6
Avg

Michigan State Spartans
13 scored players
66.5
Avg

Ohio State Buckeyes
11 scored players
64.8
Avg

Nebraska Cornhuskers
12 scored players
64.0
Avg

Iowa Hawkeyes
14 scored players
63.2
Avg

Maryland Terrapins
13 scored players
62.6
Avg

Minnesota Golden Gophers
13 scored players
62.1
Avg

USC Trojans
13 scored players
60.3
Avg

Michigan Wolverines
14 scored players
59.8
Avg

Oregon Ducks
13 scored players
59.8
Avg

Purdue Boilermakers
12 scored players
59.4
Avg

Penn State Lady Lions
12 scored players
57.0
Avg

Indiana Hoosiers
12 scored players
56.8
Avg

Illinois Fighting Illini
13 scored players
56.8
Avg

Washington Huskies
12 scored players
55.5
Avg

Northwestern Wildcats
12 scored players
54.5
Avg

Wisconsin Badgers
14 scored players
54.4
Avg

Rutgers Scarlet Knights
13 scored players
49.3
Avg
Top Athletes
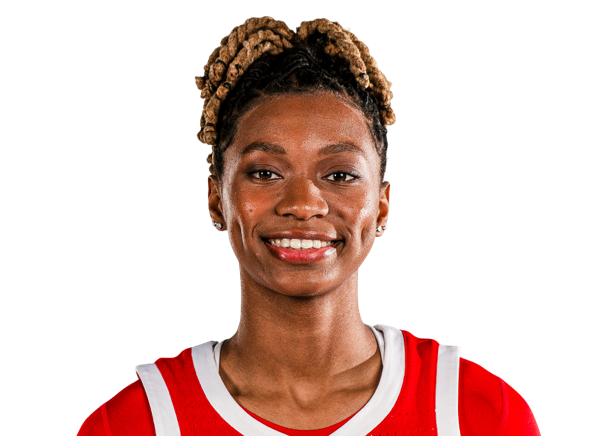
Jaloni Cambridge
G · Ohio State Buckeyes
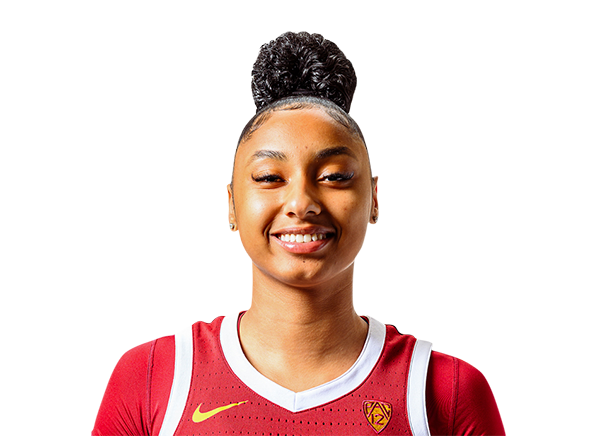
JuJu Watkins
G · USC Trojans
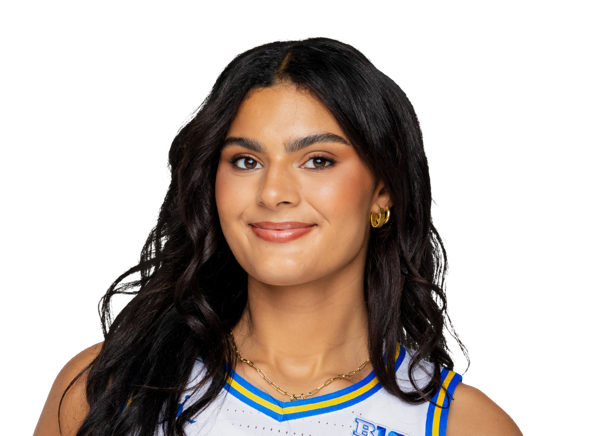
Lauren Betts
C · UCLA Bruins

Shay Ciezki
G · Indiana Hoosiers
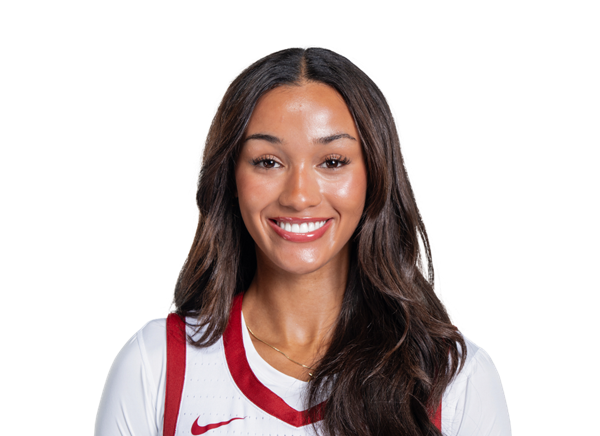
Jazzy Davidson
G · USC Trojans
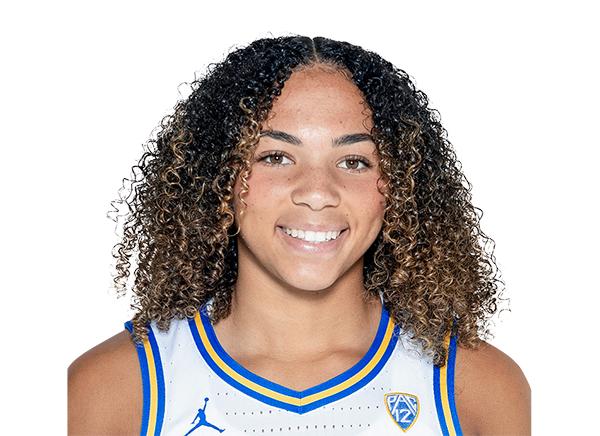
Kiki Rice
G · UCLA Bruins
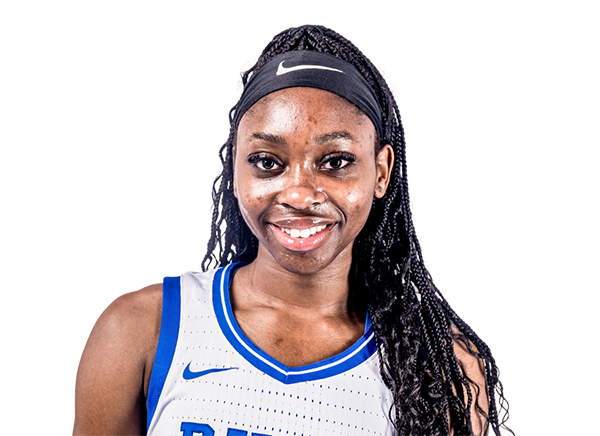
Oluchi Okananwa
G · Maryland Terrapins
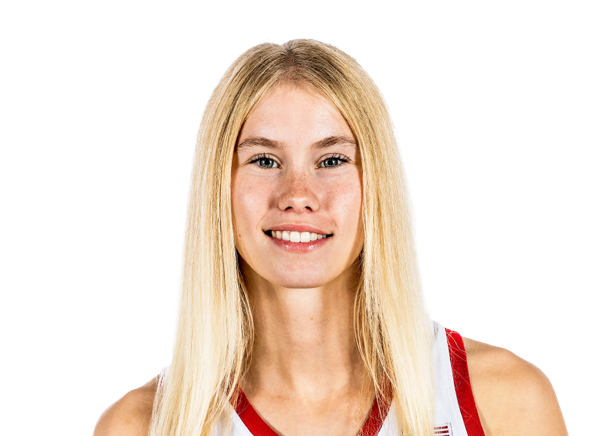
Britt Prince
G · Nebraska Cornhuskers

Ava Heiden
C · Iowa Hawkeyes
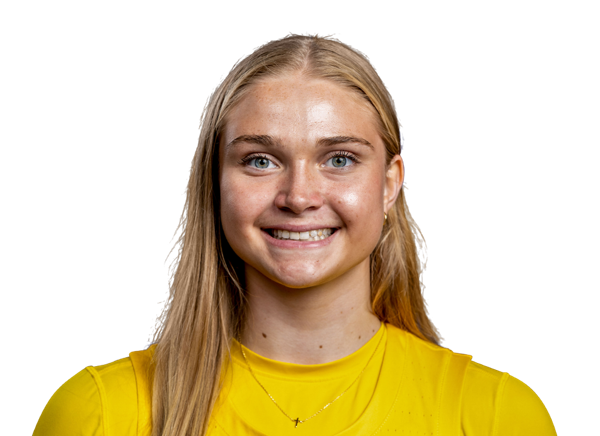
Olivia Olson
G · Michigan Wolverines
Methodology
The NILmetrics Score is a 0-100 rating that combines on-court performance, market demand signals, social presence, and risk assessment into a single number. Like Elo for chess or KenPom for basketball, it measures a player's relative standing in the college basketball NIL market — not a guaranteed dollar value or future deal price.
Performance weighs recent box-score production. Market reflects program tier, conference visibility, and demand signals. Social captures verified follower scale. Risk Assessment rewards durable availability over a full sample (a higher score means lower risk). We update scores after every Sunday's full sync.
Methodology note: women's basketball calibration is developing as the dataset grows. Treat scores as directional while the sample expands.
Read the full methodology →